We realize that at first glance your Facebook ad results might be overwhelming but there are really only a few things that you should watch out for. We will go over those here.
Video WalkThrough:
Help Article:
***These ads were ran by Afton’s in-house marketing team to illustrate the power of Facebook pixel tracking. We used a small budget to help an artist promote their show.***
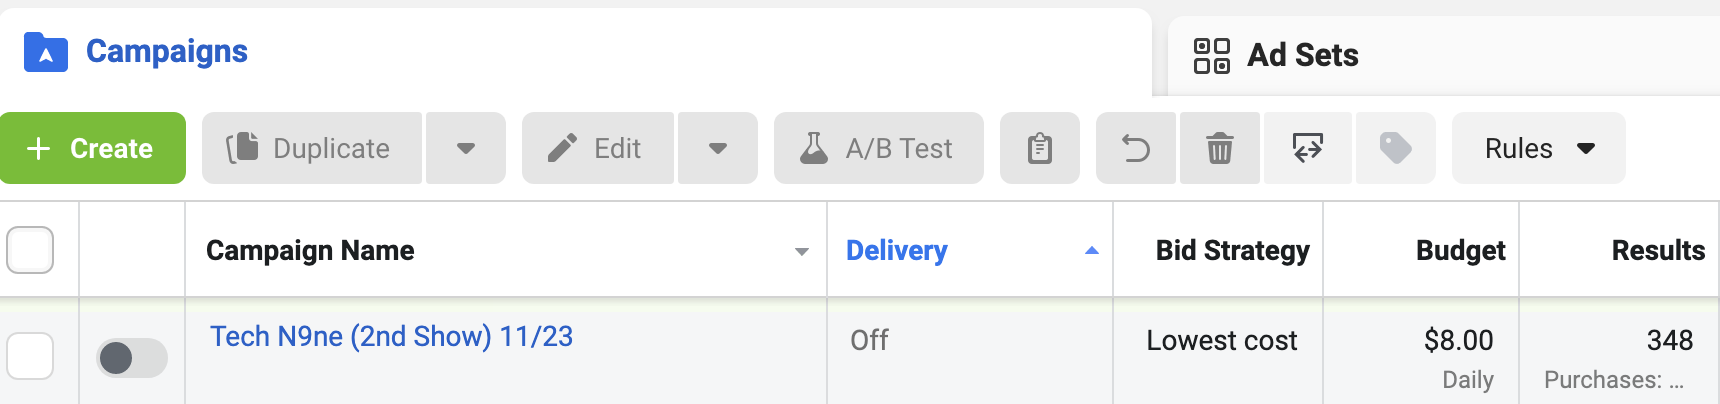
In this example we will be using an ad that we ran for the artist Tech N9ne. This campaign already ended that is why the slider on the far left is turned off. In this image you will find the daily budget which is helpful so you know for the future if you want to spend more or less on your ad. To the right of that you will find the purchases that resulted from the ad. In this case you can see there were 348 ticket purchases.
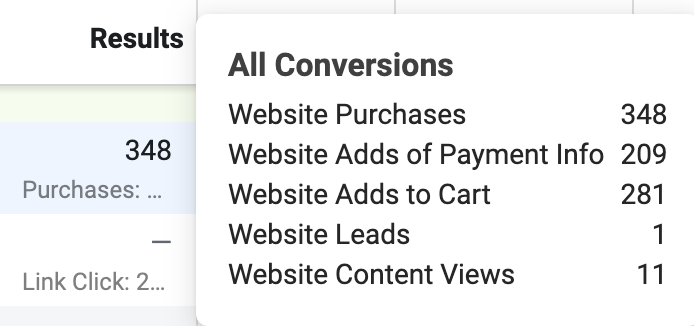
One cool feature (that is a little hidden) is that if you click on the number of purchases it will pull up more specific info. It breaks down the number of purchases, adds of payment info, adds to cart, leads and content views. Please keep in mind that you may not see all of these results depending on what items you have tracked in your account.
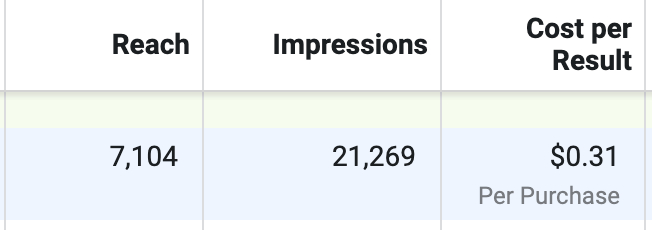
Further to the right you will see the reach and the impressions. Reach is the number of people who saw any content from your Page or about your Page. This metric is estimated. Impressions are the number of times any content from your Page or about your Page entered a person’s screen (the same person may be seeing the ad multiple times). This can give you insight into whether your ad is catching and holding people’s attention.
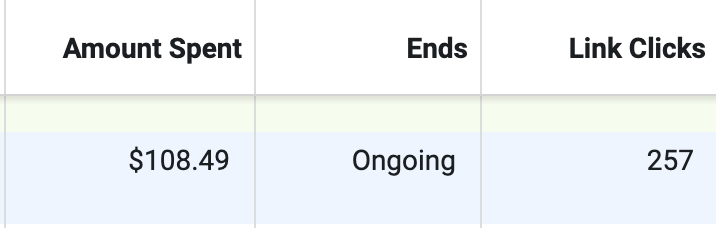
Even further to the right then the above sections you will find the total amount spent and the link clicks. The amount spent is helpful to know because you can use that info when looking at total purchases to see your ROI. The link clicks are helpful because you can see how many people are clicking the ad but not purchasing the final product.
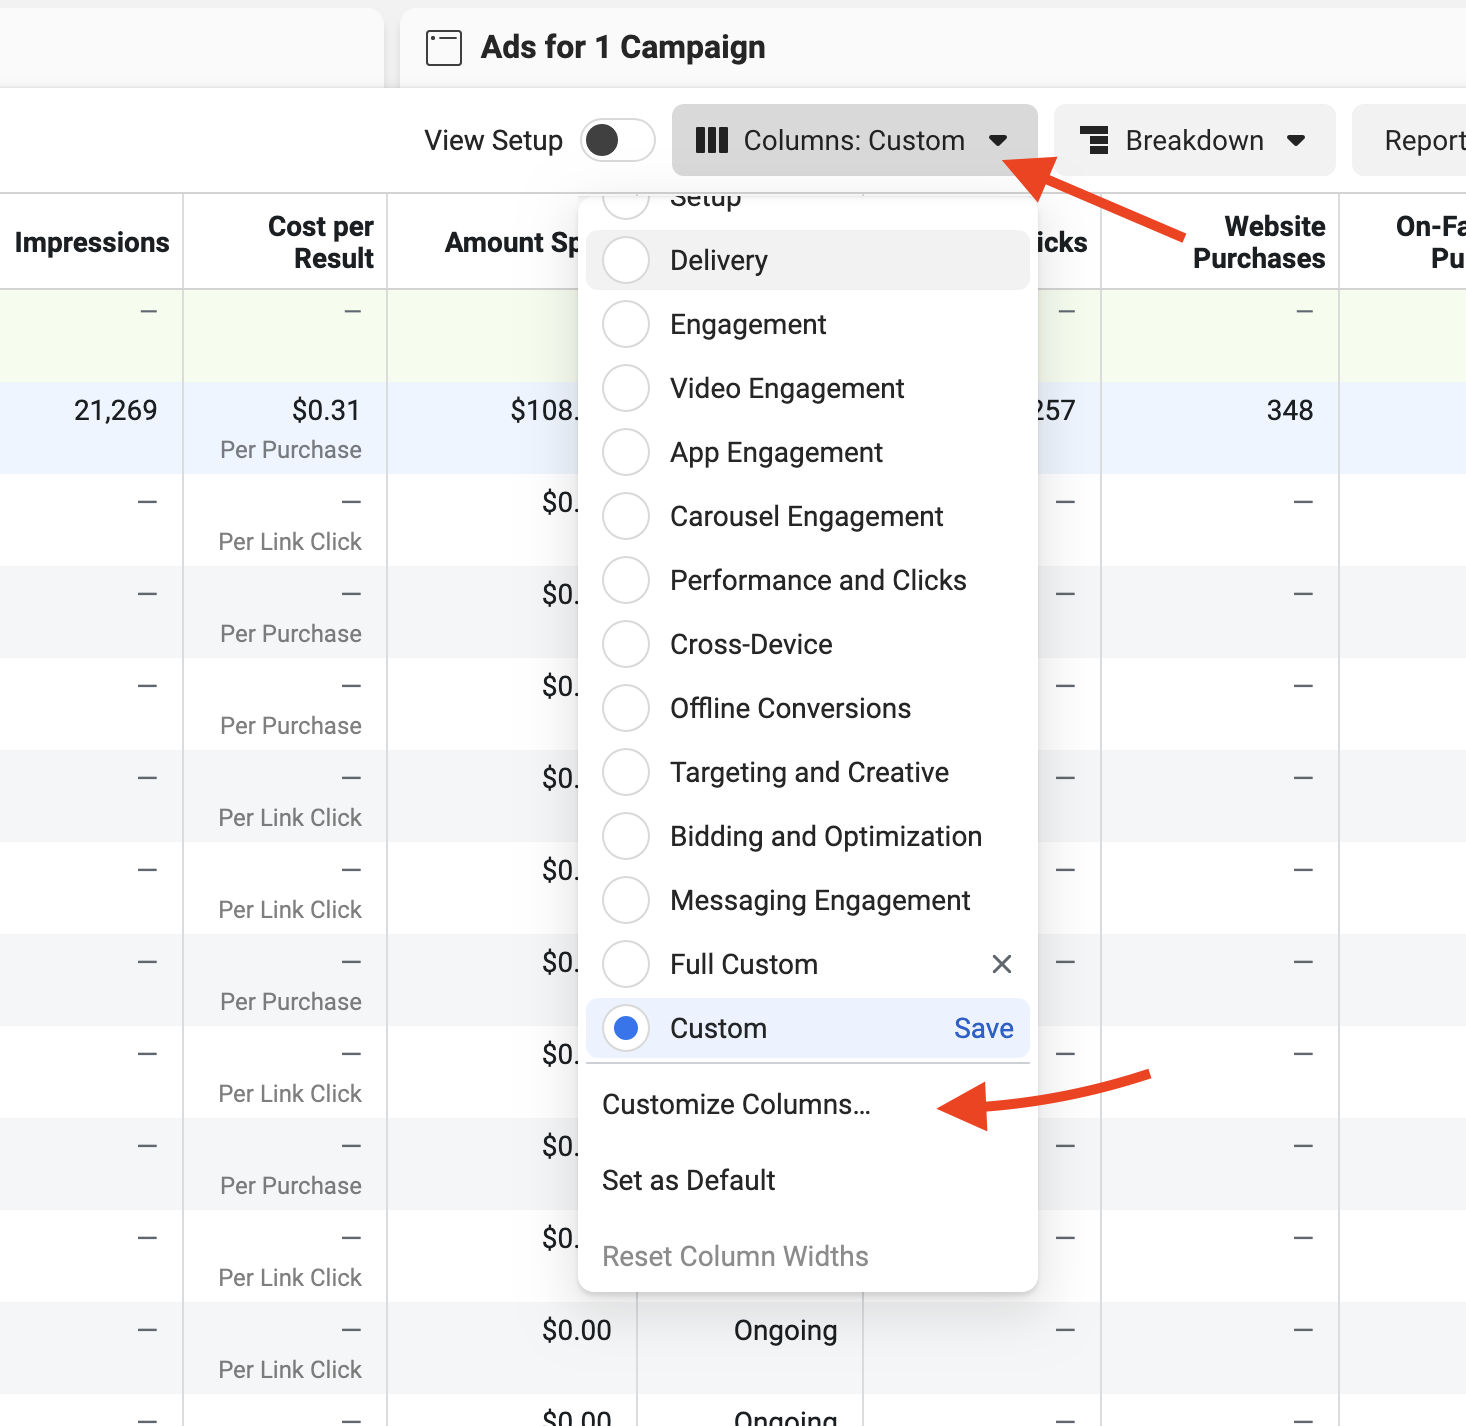
For some users that might be where their results stop. But by adding a few hidden display options you can actually get some more info from your ads. To find these options just make sure to click on ‘columns: custom‘ and then on ‘Customize Columns‘
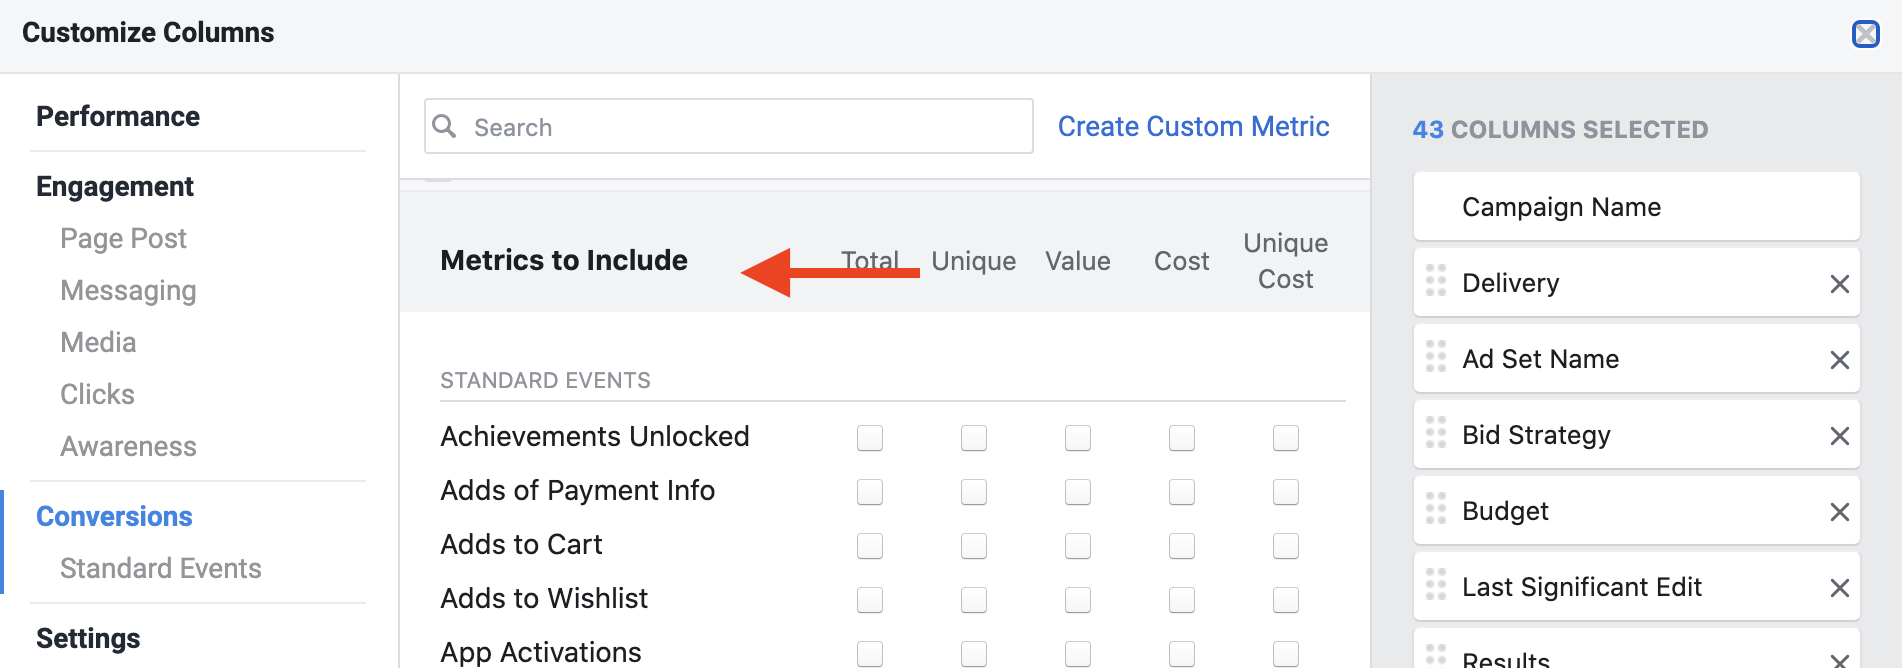
You should now see a new window that pops up. Once you see it, scroll down to the ‘Metrics to Include‘ section.
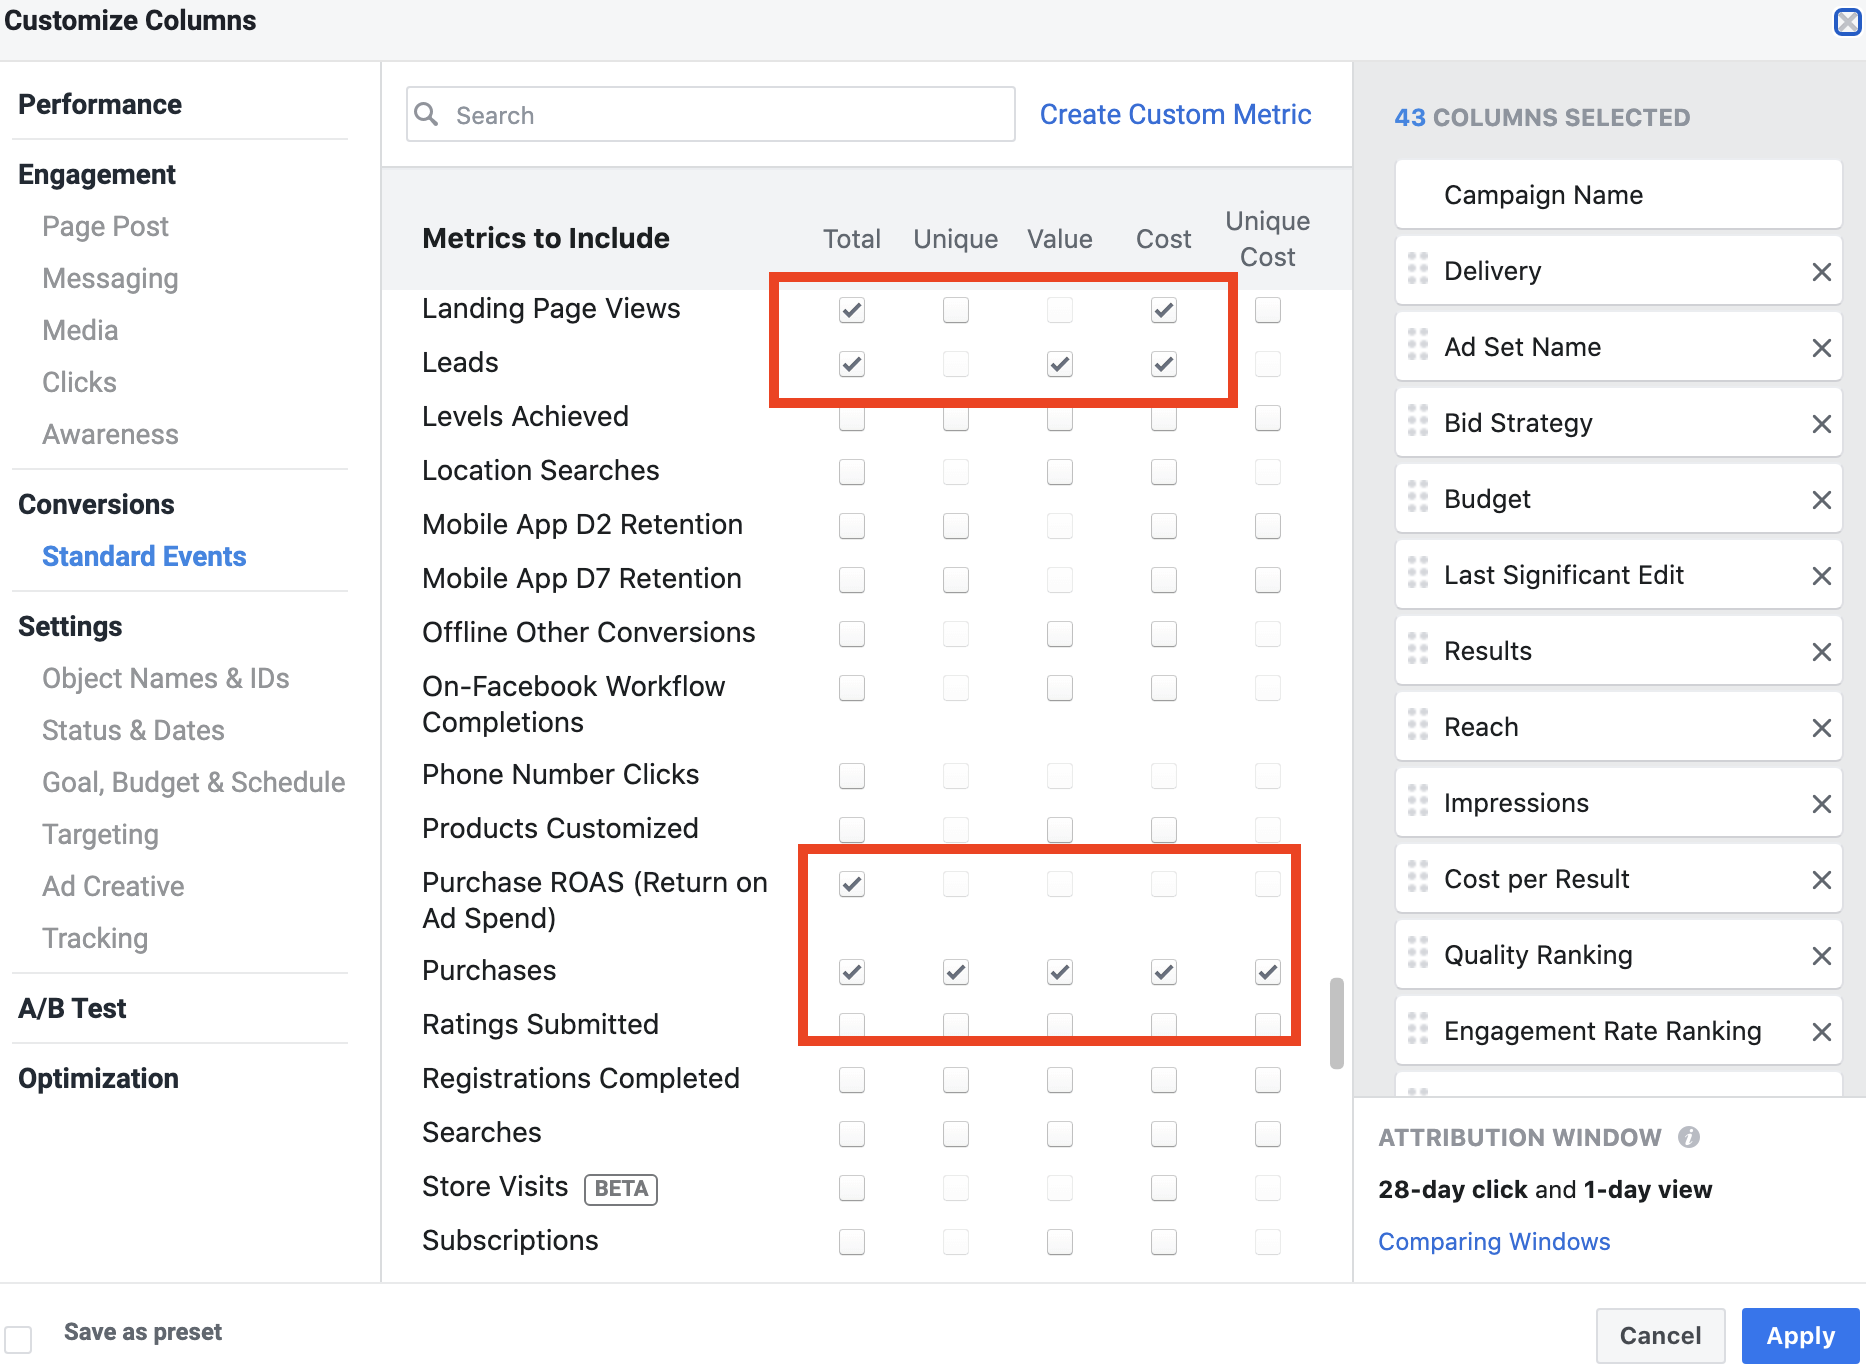
Then on the that screen make sure that you have all the boxes in the below image checked. Once you have all of those selected just make sure to hit the apply button.
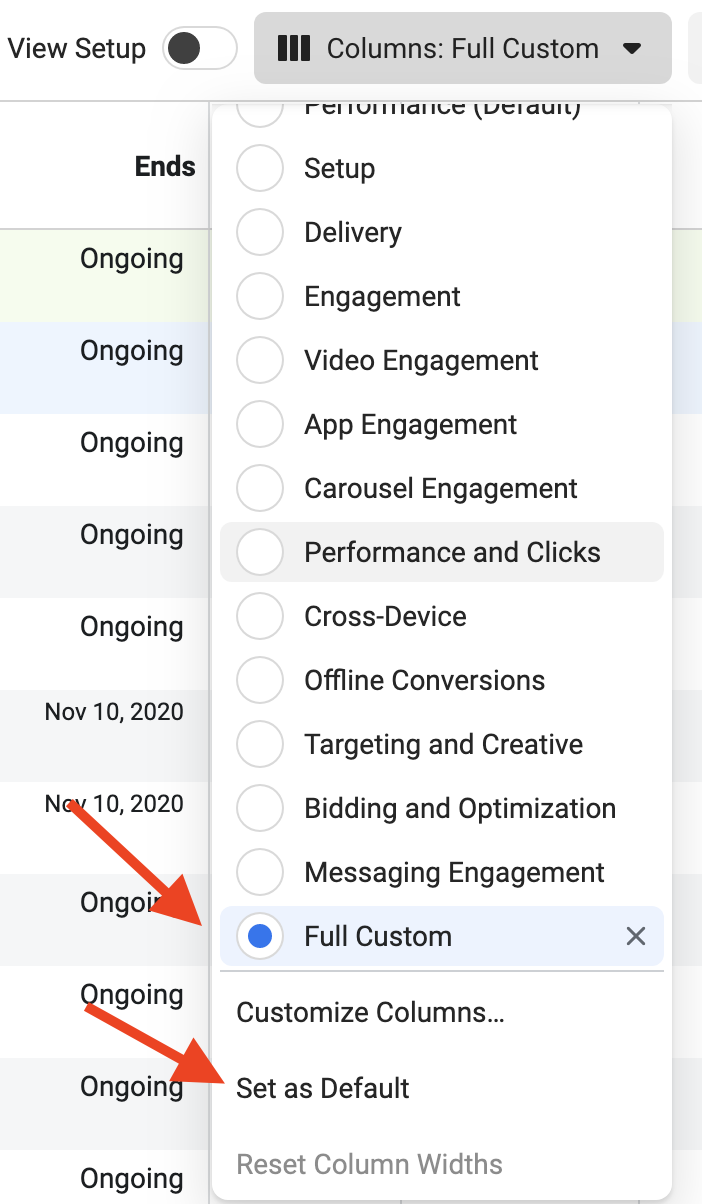
Then make sure that you go back to the ‘columns: custom‘ and click on ‘Set as Default’. That way you don’t have to go back and add these each time you want to see the results. Then it will ask you to label it. In our case we called ours ‘Full Custom’ since it is all the info that we want to be displayed.
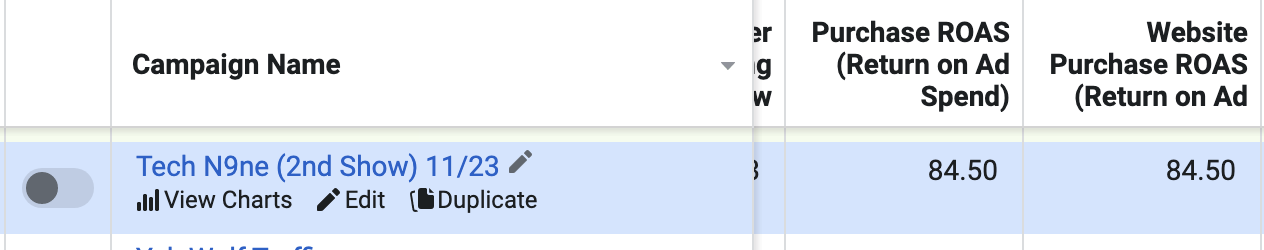
Now when you scroll further to the right you should see ROAS (Return on Ad Spend). In this example you will see that our specific ad was 84.50 which is a huge return for our money.
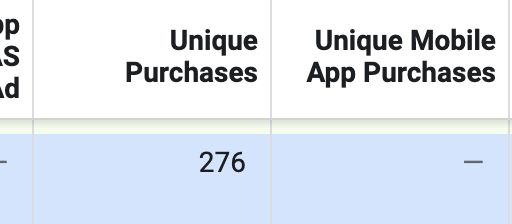
Further to the right is ‘Unique Purchases‘ which is helpful to see because it shows you how many of the purchases were repeat customers vs new customers.
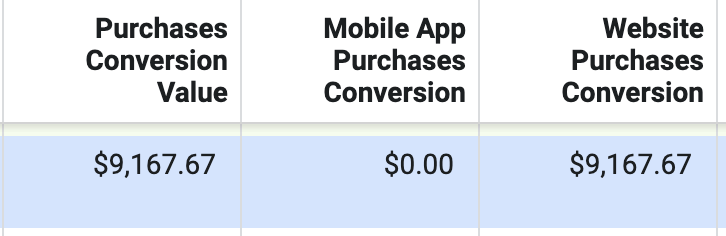
Next you will see the ‘Purchase Conversion Value‘ which is great because it shows you how much in total came in for the ad. This is divided by the amount spent for the ad is how Facebook comes up with the ROAS.
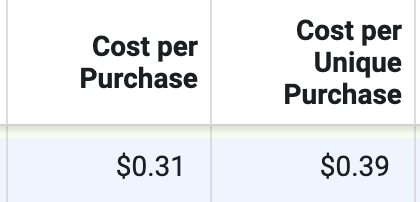
The last bit of information that is helpful is the ‘Cost Per Purchase‘ which in this case was $.31. Which is a great return for this ad because the price of the tickets was around $20.
From our experience, keeping an eye on these metrics will allow you to monitor your ads successfully and get to a ROAS you are happy with!